
DATA COLLECTION & VISUALIZATION
INFOGRAPHIC POSTER
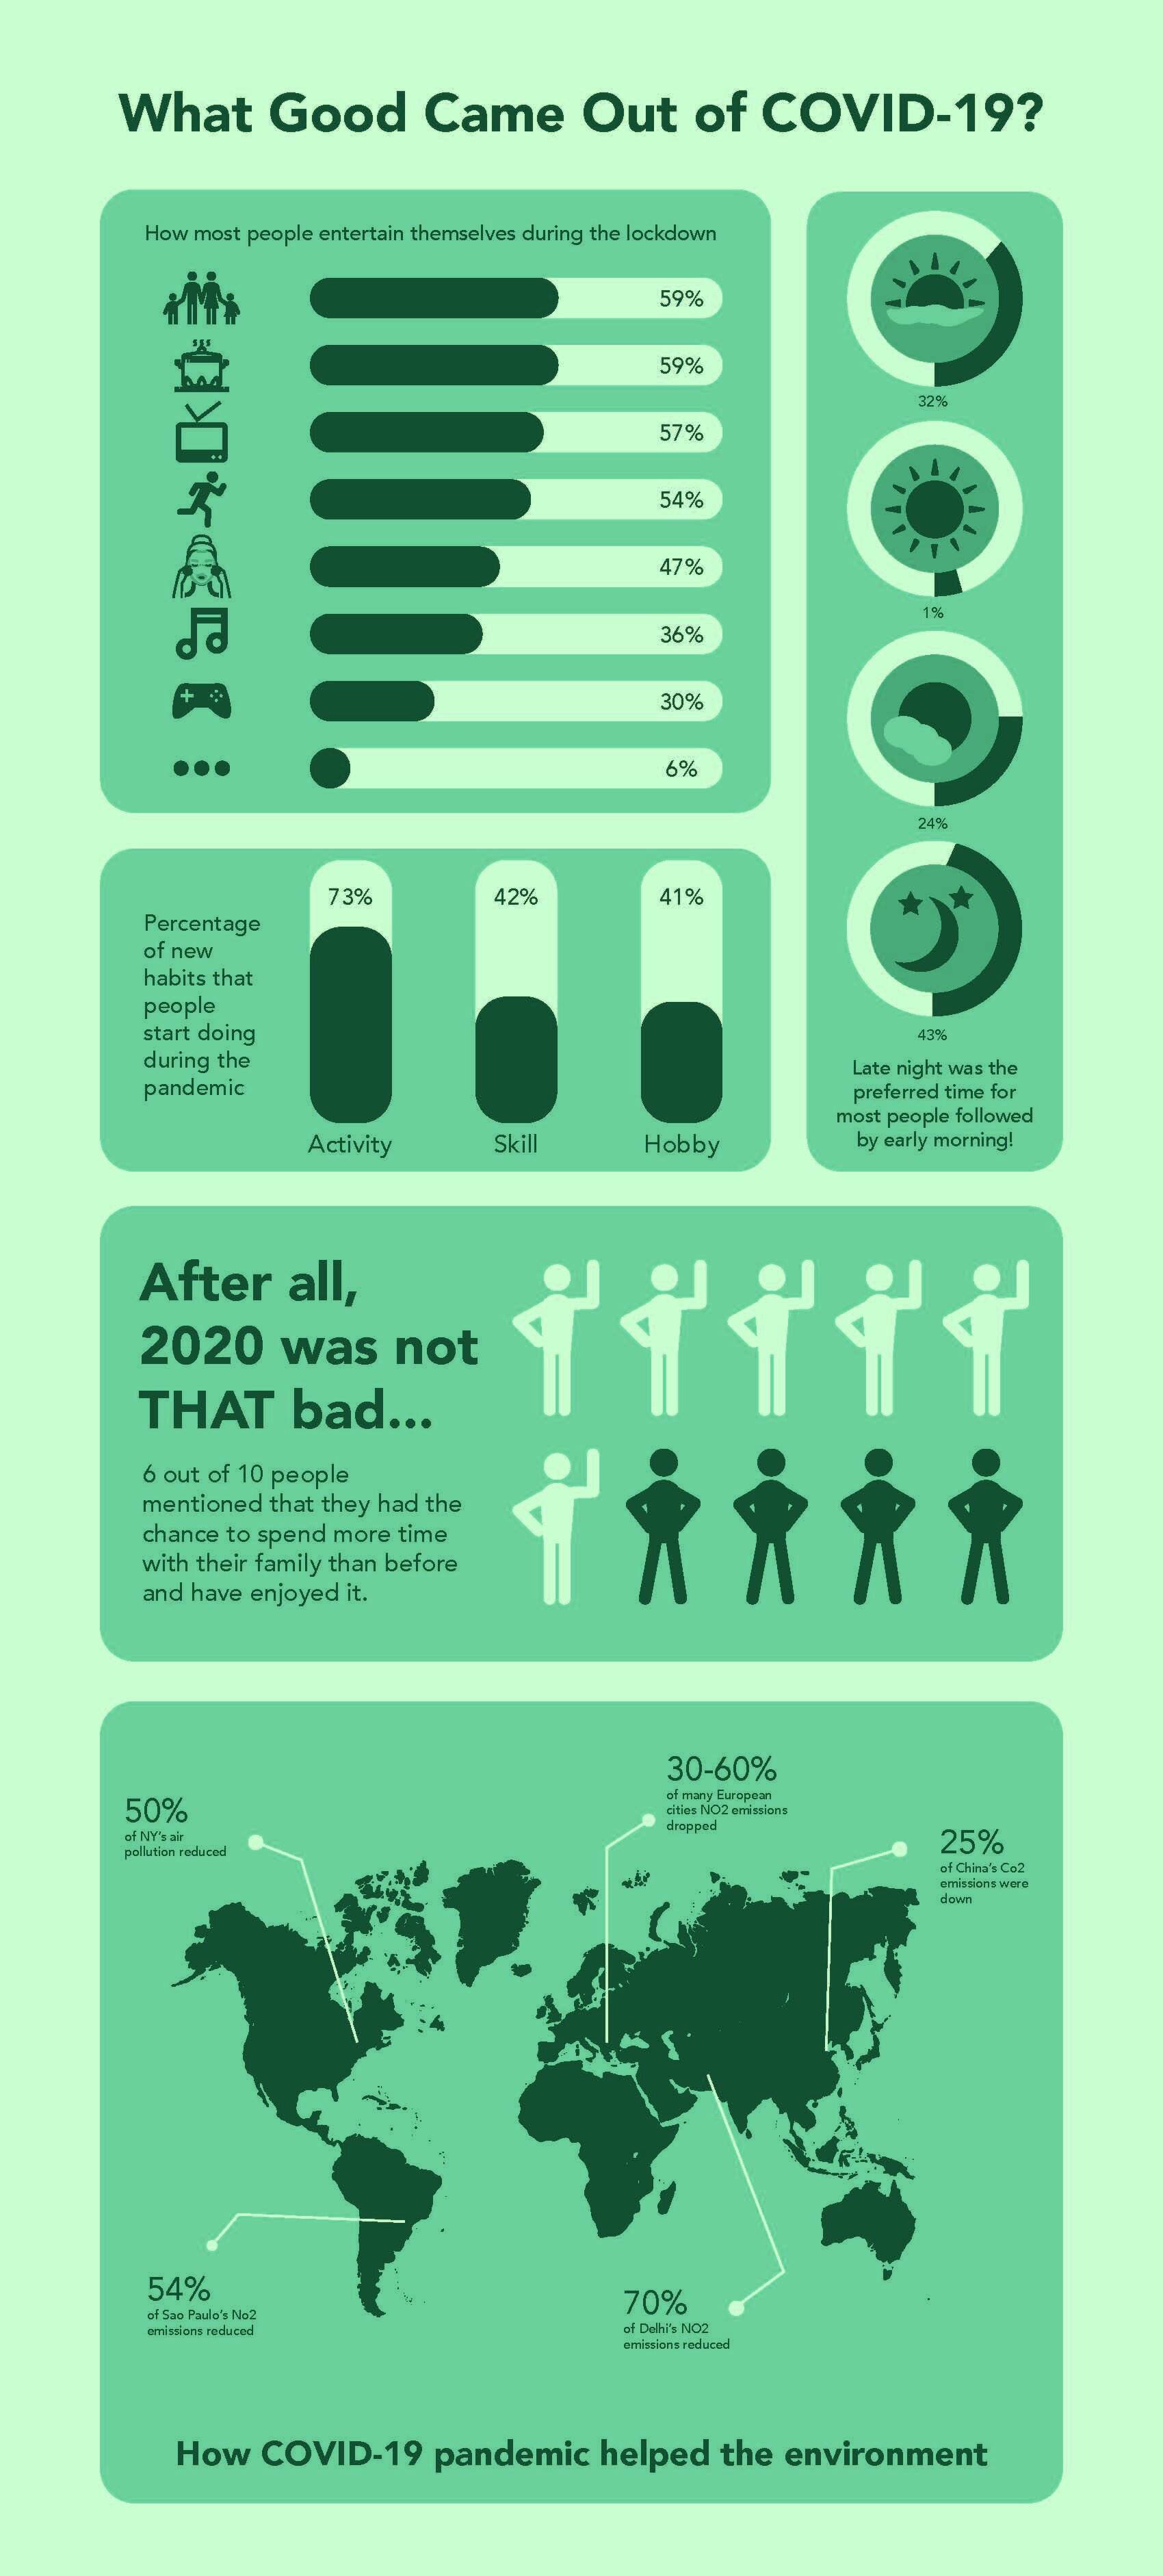
I was assigned to do an infographic poster, In 2020 most of the people were depressed because of Covid-19 (I was one of them) but I tried to look at the positive side of it.
The top part of the poster was designed based on a survey that I sent, the survey asked the people about the good that came out of Covid-19 and if they or they did not learn new stuff during the lockdown. More than 150 responses were received, I read and analyzed the answers and then I started visualizing the data. The bottom part was designed based on my research about how Covid-19 helped the environment.
DELIVERABLES
Poster.
